Long range weather forecast in North-America: precipations
data by NCEP
Precipation anomalies in the next 6 months in North-America
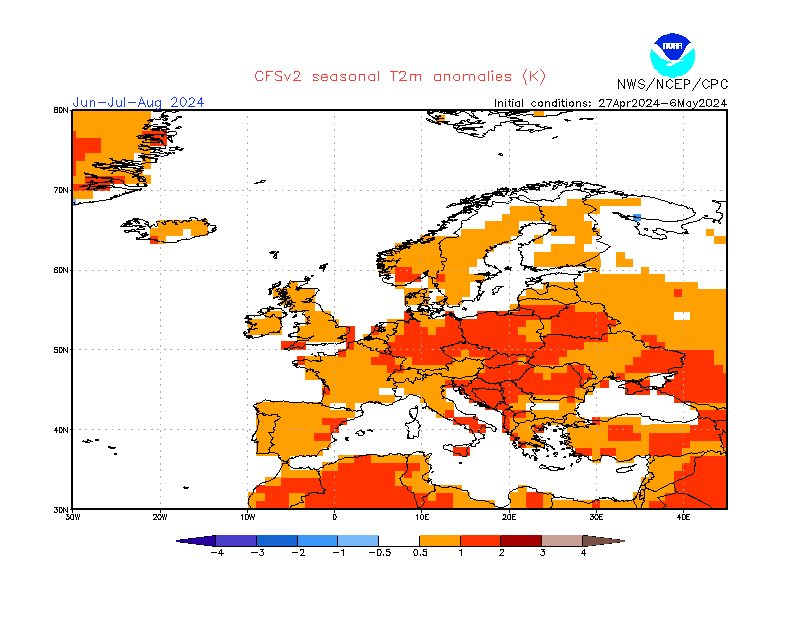
This page displays seasonal climate anomalies from the NCEP coupled forecast
system model
version 2 (CFSv2). Forecasts are from initial conditions of the last 30 days, with 4 runs from
each day. Forecast ensembles consist of 40 members from initial a period of 10 days.
The 1st ensemble (E1) is from the earliest 10 days, the 2nd ensemble (E2)
from the second earliest
10 days, and 3rd ensemble (E3) from the latest 10 days. Aomalies are with respect to 1991-2020
hindcast climatology.
Red/orange colors indicate a drier month than the 1999-2010
average of the period, while green/blue colors
indicate a rainier month. Click on the maps to enlarge.
Precipitation anomalies in the quarters of the next 6 months in North-America
Similarly as in the previous figures, the precipitation anomalies in the quarters of the next 6 months in North-America are shown below.


