GFS weather map archive

GFS analysis weather map from 2013 to today.

The maps produced on this page are owned by firenzemeteo.it. It is allowed to use and share, always citing the source.
To see the GFS FORECAST MAPS click on the red link.


GFS Map Archive - Selected Day: December 17, 2014

The Global Forecast System (GFS) is a weather forecasting model produced by the National Centers for Environmental Prediction (NCEP). Each weather forecast has as its starting point the so-called "initial conditions", that is the knowledge of a vast set of atmospheric and surface variables at the initial instant, called initialization data, used by weather forecast models to determine how they will evolve in the future.
A weather map generated using atmospheric or surface variables on instant zero is called analysis map, and is therefore a photograph of the present.
This section stores some analysis maps generated by firenzemeteo.it using the GFS initialization data (4 per day, issued at 00, 06, 12 and 18 UTC) on December 17, 2014. In particular, divided by various geographical areas (but not all present in each area) are shown:

  • 500 hPa Geopotential Height and Temperature and Mean Sea Level Pressure (MSLP)
  • 850 hPa Geopotential Height and Temperature
  • 925 hPa Geopotential Height and Temperature
  • Air temperature at 2 meters above the surface
  • Temperature anomalies at 2 m, 850 hPa, 500 hPa
  • Geopotential anomaly at 500 hPa
  • Wind speed 10 m above the ground
  • Jet stream at 200 hPa, 300 hPa, 500 hPa
  • Precipitable Water
  • CAPE and Lifted Index
  • CIN
  • Relative humidity and Omega at 850 hPa, 700 hPa, 500 hPa
 
December 2014
M T W T F S S
1
2
3
4
5
6
7
8
9
10
11
12
13
14
15
16
17
18
19
20
21
22
23
24
25
26
27
28
29
30
31

GFS maps - Europe - December 17, 2014

Click on the maps to enlarge.

GFS 00Z - Europe
Geopotential + Temp. at 500 hPa + Sea Level Pressure

GFS analysi map - Geopotential + Temp. at 500 hPa + Sea Level Pressure in Europe
									on December 17, 2014 H00

GFS 06Z - Europe
Geopotential + Temp. at 500 hPa + Sea Level Pressure

GFS analysi map - Geopotential + Temp. at 500 hPa + Sea Level Pressure in Europe
									on December 17, 2014 H06

GFS 12Z - Europe
Geopotential + Temp. at 500 hPa + Sea Level Pressure

GFS analysi map - Geopotential + Temp. at 500 hPa + Sea Level Pressure in Europe
									on December 17, 2014 H12

GFS 18Z - Europe
Geopotential + Temp. at 500 hPa + Sea Level Pressure

GFS analysi map - Geopotential + Temp. at 500 hPa + Sea Level Pressure in Europe
									on December 17, 2014 H18

GFS 00Z - Europe
Geopotential and Temperature at 850 hPa

GFS analysi map - Geopotential and Temperature at 850 hPa in Europe
									on December 17, 2014 H00

GFS 06Z - Europe
Geopotential and Temperature at 850 hPa

GFS analysi map - Geopotential and Temperature at 850 hPa in Europe
									on December 17, 2014 H06

GFS 12Z - Europe
Geopotential and Temperature at 850 hPa

GFS analysi map - Geopotential and Temperature at 850 hPa in Europe
									on December 17, 2014 H12

GFS 18Z - Europe
Geopotential and Temperature at 850 hPa

GFS analysi map - Geopotential and Temperature at 850 hPa in Europe
									on December 17, 2014 H18

GFS 00Z - Europe
Temperature at 2 m above ground

GFS analysi map - Temperature at 2 m above ground in Europe
									on December 17, 2014 H00

GFS 06Z - Europe
Temperature at 2 m above ground

GFS analysi map - Temperature at 2 m above ground in Europe
									on December 17, 2014 H06

GFS 12Z - Europe
Temperature at 2 m above ground

GFS analysi map - Temperature at 2 m above ground in Europe
									on December 17, 2014 H12

GFS 18Z - Europe
Temperature at 2 m above ground

GFS analysi map - Temperature at 2 m above ground in Europe
									on December 17, 2014 H18

GFS 00Z - Europe
Temperature Anomalies at 2 m

GFS analysi map - Temperature Anomalies at 2 m in Europe
									on December 17, 2014 H00

GFS 06Z - Europe
Temperature Anomalies at 2 m

GFS analysi map - Temperature Anomalies at 2 m in Europe
									on December 17, 2014 H06

GFS 12Z - Europe
Temperature Anomalies at 2 m

GFS analysi map - Temperature Anomalies at 2 m in Europe
									on December 17, 2014 H12

GFS 18Z - Europe
Temperature Anomalies at 2 m

GFS analysi map - Temperature Anomalies at 2 m in Europe
									on December 17, 2014 H18

GFS 00Z - Europe
Temperature Anomalies at 850 hPa

GFS analysi map - Temperature Anomalies at 850 hPa in Europe
									on December 17, 2014 H00

GFS 06Z - Europe
Temperature Anomalies at 850 hPa

GFS analysi map - Temperature Anomalies at 850 hPa in Europe
									on December 17, 2014 H06

GFS 12Z - Europe
Temperature Anomalies at 850 hPa

GFS analysi map - Temperature Anomalies at 850 hPa in Europe
									on December 17, 2014 H12

GFS 18Z - Europe
Temperature Anomalies at 850 hPa

GFS analysi map - Temperature Anomalies at 850 hPa in Europe
									on December 17, 2014 H18

GFS 00Z - Europe
Temperature Anomalies at 500 hPa

GFS analysi map - Temperature Anomalies at 500 hPa in Europe
									on December 17, 2014 H00

GFS 06Z - Europe
Temperature Anomalies at 500 hPa

GFS analysi map - Temperature Anomalies at 500 hPa in Europe
									on December 17, 2014 H06

GFS 12Z - Europe
Temperature Anomalies at 500 hPa

GFS analysi map - Temperature Anomalies at 500 hPa in Europe
									on December 17, 2014 H12

GFS 18Z - Europe
Temperature Anomalies at 500 hPa

GFS analysi map - Temperature Anomalies at 500 hPa in Europe
									on December 17, 2014 H18

GFS 00Z - Europe
Geopotential Anomalies at 500 hPa

GFS analysi map - Geopotential Anomalies at 500 hPa in Europe
									on December 17, 2014 H00

GFS 06Z - Europe
Geopotential Anomalies at 500 hPa

GFS analysi map - Geopotential Anomalies at 500 hPa in Europe
									on December 17, 2014 H06

GFS 12Z - Europe
Geopotential Anomalies at 500 hPa

GFS analysi map - Geopotential Anomalies at 500 hPa in Europe
									on December 17, 2014 H12

GFS 18Z - Europe
Geopotential Anomalies at 500 hPa

GFS analysi map - Geopotential Anomalies at 500 hPa in Europe
									on December 17, 2014 H18

GFS 00Z - Europe
Wind Speed at 10 m above ground

GFS analysi map - Wind Speed at 10 m above ground in Europe
									on December 17, 2014 H00

GFS 06Z - Europe
Wind Speed at 10 m above ground

GFS analysi map - Wind Speed at 10 m above ground in Europe
									on December 17, 2014 H06

GFS 12Z - Europe
Wind Speed at 10 m above ground

GFS analysi map - Wind Speed at 10 m above ground in Europe
									on December 17, 2014 H12

GFS 18Z - Europe
Wind Speed at 10 m above ground

GFS analysi map - Wind Speed at 10 m above ground in Europe
									on December 17, 2014 H18

GFS 00Z - Europe
Jet Stream at 300 hPa

GFS analysi map - Jet Stream at 300 hPa in Europe
									on December 17, 2014 H00

GFS 06Z - Europe
Jet Stream at 300 hPa

GFS analysi map - Jet Stream at 300 hPa in Europe
									on December 17, 2014 H06

GFS 12Z - Europe
Jet Stream at 300 hPa

GFS analysi map - Jet Stream at 300 hPa in Europe
									on December 17, 2014 H12

GFS 18Z - Europe
Jet Stream at 300 hPa

GFS analysi map - Jet Stream at 300 hPa in Europe
									on December 17, 2014 H18

GFS 00Z - Europe
Jet Stream at 200 hPa

GFS analysi map - Jet Stream at 200 hPa in Europe
									on December 17, 2014 H00

GFS 06Z - Europe
Jet Stream at 200 hPa

GFS analysi map - Jet Stream at 200 hPa in Europe
									on December 17, 2014 H06

GFS 12Z - Europe
Jet Stream at 200 hPa

GFS analysi map - Jet Stream at 200 hPa in Europe
									on December 17, 2014 H12

GFS 18Z - Europe
Jet Stream at 200 hPa

GFS analysi map - Jet Stream at 200 hPa in Europe
									on December 17, 2014 H18

GFS maps - Italy - December 17, 2014

Click on the maps to enlarge.

GFS 00Z - Italy
Geopotential + Temp. at 500 hPa + Sea Level Pressure

GFS analysi map - Geopotential + Temp. at 500 hPa + Sea Level Pressure in Italy
									on December 17, 2014 H00

GFS 06Z - Italy
Geopotential + Temp. at 500 hPa + Sea Level Pressure

GFS analysi map - Geopotential + Temp. at 500 hPa + Sea Level Pressure in Italy
									on December 17, 2014 H06

GFS 12Z - Italy
Geopotential + Temp. at 500 hPa + Sea Level Pressure

GFS analysi map - Geopotential + Temp. at 500 hPa + Sea Level Pressure in Italy
									on December 17, 2014 H12

GFS 18Z - Italy
Geopotential + Temp. at 500 hPa + Sea Level Pressure

GFS analysi map - Geopotential + Temp. at 500 hPa + Sea Level Pressure in Italy
									on December 17, 2014 H18

GFS 00Z - Italy
Geopotential and Temperature at 850 hPa

GFS analysi map - Geopotential and Temperature at 850 hPa in Italy
									on December 17, 2014 H00

GFS 06Z - Italy
Geopotential and Temperature at 850 hPa

GFS analysi map - Geopotential and Temperature at 850 hPa in Italy
									on December 17, 2014 H06

GFS 12Z - Italy
Geopotential and Temperature at 850 hPa

GFS analysi map - Geopotential and Temperature at 850 hPa in Italy
									on December 17, 2014 H12

GFS 18Z - Italy
Geopotential and Temperature at 850 hPa

GFS analysi map - Geopotential and Temperature at 850 hPa in Italy
									on December 17, 2014 H18

GFS 00Z - Italy
Geopotential and Temperature at 925 hPa

GFS analysi map - Geopotential and Temperature at 925 hPa in Italy
									on December 17, 2014 H00

GFS 06Z - Italy
Geopotential and Temperature at 925 hPa

GFS analysi map - Geopotential and Temperature at 925 hPa in Italy
									on December 17, 2014 H06

GFS 12Z - Italy
Geopotential and Temperature at 925 hPa

GFS analysi map - Geopotential and Temperature at 925 hPa in Italy
									on December 17, 2014 H12

GFS 18Z - Italy
Geopotential and Temperature at 925 hPa

GFS analysi map - Geopotential and Temperature at 925 hPa in Italy
									on December 17, 2014 H18

GFS 00Z - Italy
Temperature at 2 m above ground

GFS analysi map - Temperature at 2 m above ground in Italy
									on December 17, 2014 H00

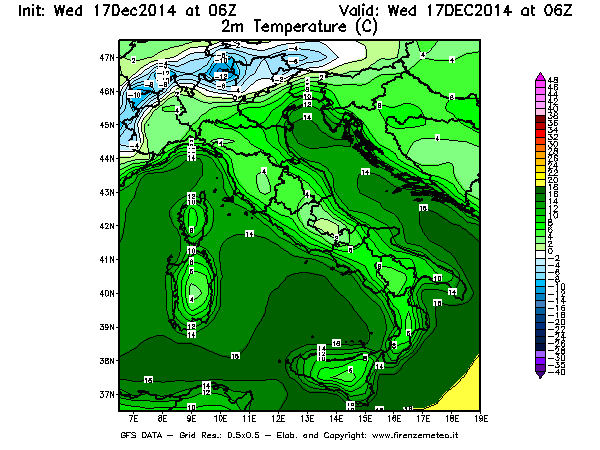
GFS 06Z - Italy
Temperature at 2 m above ground

GFS analysi map - Temperature at 2 m above ground in Italy
									on December 17, 2014 H06

GFS 12Z - Italy
Temperature at 2 m above ground

GFS analysi map - Temperature at 2 m above ground in Italy
									on December 17, 2014 H12

GFS 18Z - Italy
Temperature at 2 m above ground

GFS analysi map - Temperature at 2 m above ground in Italy
									on December 17, 2014 H18

GFS 00Z - Italy
Temperature Anomalies at 2 m

GFS analysi map - Temperature Anomalies at 2 m in Italy
									on December 17, 2014 H00

GFS 06Z - Italy
Temperature Anomalies at 2 m

GFS analysi map - Temperature Anomalies at 2 m in Italy
									on December 17, 2014 H06

GFS 12Z - Italy
Temperature Anomalies at 2 m

GFS analysi map - Temperature Anomalies at 2 m in Italy
									on December 17, 2014 H12

GFS 18Z - Italy
Temperature Anomalies at 2 m

GFS analysi map - Temperature Anomalies at 2 m in Italy
									on December 17, 2014 H18

GFS 00Z - Italy
Temperature Anomalies at 850 hPa

GFS analysi map - Temperature Anomalies at 850 hPa in Italy
									on December 17, 2014 H00

GFS 06Z - Italy
Temperature Anomalies at 850 hPa

GFS analysi map - Temperature Anomalies at 850 hPa in Italy
									on December 17, 2014 H06

GFS 12Z - Italy
Temperature Anomalies at 850 hPa

GFS analysi map - Temperature Anomalies at 850 hPa in Italy
									on December 17, 2014 H12

GFS 18Z - Italy
Temperature Anomalies at 850 hPa

GFS analysi map - Temperature Anomalies at 850 hPa in Italy
									on December 17, 2014 H18

GFS 00Z - Italy
Temperature Anomalies at 500 hPa

GFS analysi map - Temperature Anomalies at 500 hPa in Italy
									on December 17, 2014 H00

GFS 06Z - Italy
Temperature Anomalies at 500 hPa

GFS analysi map - Temperature Anomalies at 500 hPa in Italy
									on December 17, 2014 H06

GFS 12Z - Italy
Temperature Anomalies at 500 hPa

GFS analysi map - Temperature Anomalies at 500 hPa in Italy
									on December 17, 2014 H12

GFS 18Z - Italy
Temperature Anomalies at 500 hPa

GFS analysi map - Temperature Anomalies at 500 hPa in Italy
									on December 17, 2014 H18

GFS 00Z - Italy
Geopotential Anomalies at 500 hPa

GFS analysi map - Geopotential Anomalies at 500 hPa in Italy
									on December 17, 2014 H00

GFS 06Z - Italy
Geopotential Anomalies at 500 hPa

GFS analysi map - Geopotential Anomalies at 500 hPa in Italy
									on December 17, 2014 H06

GFS 12Z - Italy
Geopotential Anomalies at 500 hPa

GFS analysi map - Geopotential Anomalies at 500 hPa in Italy
									on December 17, 2014 H12

GFS 18Z - Italy
Geopotential Anomalies at 500 hPa

GFS analysi map - Geopotential Anomalies at 500 hPa in Italy
									on December 17, 2014 H18

GFS 00Z - Italy
Wind Speed at 10 m above ground

GFS analysi map - Wind Speed at 10 m above ground in Italy
									on December 17, 2014 H00

GFS 06Z - Italy
Wind Speed at 10 m above ground

GFS analysi map - Wind Speed at 10 m above ground in Italy
									on December 17, 2014 H06

GFS 12Z - Italy
Wind Speed at 10 m above ground

GFS analysi map - Wind Speed at 10 m above ground in Italy
									on December 17, 2014 H12

GFS 18Z - Italy
Wind Speed at 10 m above ground

GFS analysi map - Wind Speed at 10 m above ground in Italy
									on December 17, 2014 H18

GFS 00Z - Italy
Wind Speed at 500 hPa

GFS analysi map - Wind Speed at 500 hPa in Italy
									on December 17, 2014 H00

GFS 06Z - Italy
Wind Speed at 500 hPa

GFS analysi map - Wind Speed at 500 hPa in Italy
									on December 17, 2014 H06

GFS 12Z - Italy
Wind Speed at 500 hPa

GFS analysi map - Wind Speed at 500 hPa in Italy
									on December 17, 2014 H12

GFS 18Z - Italy
Wind Speed at 500 hPa

GFS analysi map - Wind Speed at 500 hPa in Italy
									on December 17, 2014 H18

GFS 00Z - Italy
Precipitable Water

GFS analysi map - Precipitable Water in Italy
									on December 17, 2014 H00

GFS 06Z - Italy
Precipitable Water

GFS analysi map - Precipitable Water in Italy
									on December 17, 2014 H06

GFS 12Z - Italy
Precipitable Water

GFS analysi map - Precipitable Water in Italy
									on December 17, 2014 H12

GFS 18Z - Italy
Precipitable Water

GFS analysi map - Precipitable Water in Italy
									on December 17, 2014 H18

GFS 00Z - Italy
CAPE and Lifted Index

GFS analysi map - CAPE and Lifted Index in Italy
									on December 17, 2014 H00

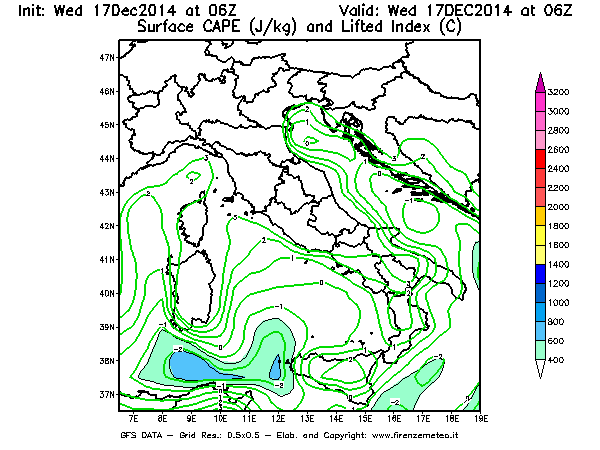
GFS 06Z - Italy
CAPE and Lifted Index

GFS analysi map - CAPE and Lifted Index in Italy
									on December 17, 2014 H06

GFS 12Z - Italy
CAPE and Lifted Index

GFS analysi map - CAPE and Lifted Index in Italy
									on December 17, 2014 H12

GFS 18Z - Italy
CAPE and Lifted Index

GFS analysi map - CAPE and Lifted Index in Italy
									on December 17, 2014 H18

GFS 00Z - Italy
CIN

GFS analysi map - CIN in Italy
									on December 17, 2014 H00

GFS 06Z - Italy
CIN

GFS analysi map - CIN in Italy
									on December 17, 2014 H06

GFS 12Z - Italy
CIN

GFS analysi map - CIN in Italy
									on December 17, 2014 H12

GFS 18Z - Italy
CIN

GFS analysi map - CIN in Italy
									on December 17, 2014 H18

GFS 00Z - Italy
Relative Umidity and Omega at 850 hPa

GFS analysi map - Relative Umidity and Omega at 850 hPa in Italy
									on December 17, 2014 H00

GFS 06Z - Italy
Relative Umidity and Omega at 850 hPa

GFS analysi map - Relative Umidity and Omega at 850 hPa in Italy
									on December 17, 2014 H06

GFS 12Z - Italy
Relative Umidity and Omega at 850 hPa

GFS analysi map - Relative Umidity and Omega at 850 hPa in Italy
									on December 17, 2014 H12

GFS 18Z - Italy
Relative Umidity and Omega at 850 hPa

GFS analysi map - Relative Umidity and Omega at 850 hPa in Italy
									on December 17, 2014 H18

GFS 00Z - Italy
Relative Umidity and Omega at 700 hPa

GFS analysi map - Relative Umidity and Omega at 700 hPa in Italy
									on December 17, 2014 H00

GFS 06Z - Italy
Relative Umidity and Omega at 700 hPa

GFS analysi map - Relative Umidity and Omega at 700 hPa in Italy
									on December 17, 2014 H06

GFS 12Z - Italy
Relative Umidity and Omega at 700 hPa

GFS analysi map - Relative Umidity and Omega at 700 hPa in Italy
									on December 17, 2014 H12

GFS 18Z - Italy
Relative Umidity and Omega at 700 hPa

GFS analysi map - Relative Umidity and Omega at 700 hPa in Italy
									on December 17, 2014 H18

GFS 00Z - Italy
Relative Umidity and Omega sat 500 hPa

GFS analysi map - Relative Umidity and Omega sat 500 hPa in Italy
									on December 17, 2014 H00

GFS 06Z - Italy
Relative Umidity and Omega sat 500 hPa

GFS analysi map - Relative Umidity and Omega sat 500 hPa in Italy
									on December 17, 2014 H06

GFS 12Z - Italy
Relative Umidity and Omega sat 500 hPa

GFS analysi map - Relative Umidity and Omega sat 500 hPa in Italy
									on December 17, 2014 H12

GFS 18Z - Italy
Relative Umidity and Omega sat 500 hPa

GFS analysi map - Relative Umidity and Omega sat 500 hPa in Italy
									on December 17, 2014 H18

GFS maps - Northern Italy - December 17, 2014

Click on the maps to enlarge.

GFS 00Z - Northern Italy
Geopotential + Temp. at 500 hPa + Sea Level Pressure

GFS analysi map - Geopotential + Temp. at 500 hPa + Sea Level Pressure in Northern Italy
									on December 17, 2014 H00

GFS 06Z - Northern Italy
Geopotential + Temp. at 500 hPa + Sea Level Pressure

GFS analysi map - Geopotential + Temp. at 500 hPa + Sea Level Pressure in Northern Italy
									on December 17, 2014 H06

GFS 12Z - Northern Italy
Geopotential + Temp. at 500 hPa + Sea Level Pressure

GFS analysi map - Geopotential + Temp. at 500 hPa + Sea Level Pressure in Northern Italy
									on December 17, 2014 H12

GFS 18Z - Northern Italy
Geopotential + Temp. at 500 hPa + Sea Level Pressure

GFS analysi map - Geopotential + Temp. at 500 hPa + Sea Level Pressure in Northern Italy
									on December 17, 2014 H18

GFS 00Z - Northern Italy
Geopotential and Temperature at 850 hPa

GFS analysi map - Geopotential and Temperature at 850 hPa in Northern Italy
									on December 17, 2014 H00

GFS 06Z - Northern Italy
Geopotential and Temperature at 850 hPa

GFS analysi map - Geopotential and Temperature at 850 hPa in Northern Italy
									on December 17, 2014 H06

GFS 12Z - Northern Italy
Geopotential and Temperature at 850 hPa

GFS analysi map - Geopotential and Temperature at 850 hPa in Northern Italy
									on December 17, 2014 H12

GFS 18Z - Northern Italy
Geopotential and Temperature at 850 hPa

GFS analysi map - Geopotential and Temperature at 850 hPa in Northern Italy
									on December 17, 2014 H18

GFS 00Z - Northern Italy
Geopotential and Temperature at 925 hPa

GFS analysi map - Geopotential and Temperature at 925 hPa in Northern Italy
									on December 17, 2014 H00

GFS 06Z - Northern Italy
Geopotential and Temperature at 925 hPa

GFS analysi map - Geopotential and Temperature at 925 hPa in Northern Italy
									on December 17, 2014 H06

GFS 12Z - Northern Italy
Geopotential and Temperature at 925 hPa

GFS analysi map - Geopotential and Temperature at 925 hPa in Northern Italy
									on December 17, 2014 H12

GFS 18Z - Northern Italy
Geopotential and Temperature at 925 hPa

GFS analysi map - Geopotential and Temperature at 925 hPa in Northern Italy
									on December 17, 2014 H18

GFS 00Z - Northern Italy
Temperature at 2 m above ground

GFS analysi map - Temperature at 2 m above ground in Northern Italy
									on December 17, 2014 H00

GFS 06Z - Northern Italy
Temperature at 2 m above ground

GFS analysi map - Temperature at 2 m above ground in Northern Italy
									on December 17, 2014 H06

GFS 12Z - Northern Italy
Temperature at 2 m above ground

GFS analysi map - Temperature at 2 m above ground in Northern Italy
									on December 17, 2014 H12

GFS 18Z - Northern Italy
Temperature at 2 m above ground

GFS analysi map - Temperature at 2 m above ground in Northern Italy
									on December 17, 2014 H18

GFS 00Z - Northern Italy
Temperature Anomalies at 2 m

GFS analysi map - Temperature Anomalies at 2 m in Northern Italy
									on December 17, 2014 H00

GFS 06Z - Northern Italy
Temperature Anomalies at 2 m

GFS analysi map - Temperature Anomalies at 2 m in Northern Italy
									on December 17, 2014 H06

GFS 12Z - Northern Italy
Temperature Anomalies at 2 m

GFS analysi map - Temperature Anomalies at 2 m in Northern Italy
									on December 17, 2014 H12

GFS 18Z - Northern Italy
Temperature Anomalies at 2 m

GFS analysi map - Temperature Anomalies at 2 m in Northern Italy
									on December 17, 2014 H18

GFS 00Z - Northern Italy
Temperature Anomalies at 850 hPa

GFS analysi map - Temperature Anomalies at 850 hPa in Northern Italy
									on December 17, 2014 H00

GFS 06Z - Northern Italy
Temperature Anomalies at 850 hPa

GFS analysi map - Temperature Anomalies at 850 hPa in Northern Italy
									on December 17, 2014 H06

GFS 12Z - Northern Italy
Temperature Anomalies at 850 hPa

GFS analysi map - Temperature Anomalies at 850 hPa in Northern Italy
									on December 17, 2014 H12

GFS 18Z - Northern Italy
Temperature Anomalies at 850 hPa

GFS analysi map - Temperature Anomalies at 850 hPa in Northern Italy
									on December 17, 2014 H18

GFS 00Z - Northern Italy
Temperature Anomalies at 500 hPa

GFS analysi map - Temperature Anomalies at 500 hPa in Northern Italy
									on December 17, 2014 H00

GFS 06Z - Northern Italy
Temperature Anomalies at 500 hPa

GFS analysi map - Temperature Anomalies at 500 hPa in Northern Italy
									on December 17, 2014 H06

GFS 12Z - Northern Italy
Temperature Anomalies at 500 hPa

GFS analysi map - Temperature Anomalies at 500 hPa in Northern Italy
									on December 17, 2014 H12

GFS 18Z - Northern Italy
Temperature Anomalies at 500 hPa

GFS analysi map - Temperature Anomalies at 500 hPa in Northern Italy
									on December 17, 2014 H18

GFS 00Z - Northern Italy
Wind Speed at 10 m above ground

GFS analysi map - Wind Speed at 10 m above ground in Northern Italy
									on December 17, 2014 H00

GFS 06Z - Northern Italy
Wind Speed at 10 m above ground

GFS analysi map - Wind Speed at 10 m above ground in Northern Italy
									on December 17, 2014 H06

GFS 12Z - Northern Italy
Wind Speed at 10 m above ground

GFS analysi map - Wind Speed at 10 m above ground in Northern Italy
									on December 17, 2014 H12

GFS 18Z - Northern Italy
Wind Speed at 10 m above ground

GFS analysi map - Wind Speed at 10 m above ground in Northern Italy
									on December 17, 2014 H18

GFS 00Z - Northern Italy
CAPE and Lifted Index

GFS analysi map - CAPE and Lifted Index in Northern Italy
									on December 17, 2014 H00

GFS 06Z - Northern Italy
CAPE and Lifted Index

GFS analysi map - CAPE and Lifted Index in Northern Italy
									on December 17, 2014 H06

GFS 12Z - Northern Italy
CAPE and Lifted Index

GFS analysi map - CAPE and Lifted Index in Northern Italy
									on December 17, 2014 H12

GFS 18Z - Northern Italy
CAPE and Lifted Index

GFS analysi map - CAPE and Lifted Index in Northern Italy
									on December 17, 2014 H18

GFS 00Z - Northern Italy
CIN

GFS analysi map - CIN in Northern Italy
									on December 17, 2014 H00

GFS 06Z - Northern Italy
CIN

GFS analysi map - CIN in Northern Italy
									on December 17, 2014 H06

GFS 12Z - Northern Italy
CIN

GFS analysi map - CIN in Northern Italy
									on December 17, 2014 H12

GFS 18Z - Northern Italy
CIN

GFS analysi map - CIN in Northern Italy
									on December 17, 2014 H18

GFS maps - Central Italy - December 17, 2014

Click on the maps to enlarge.

GFS 00Z - Central Italy
Geopotential + Temp. at 500 hPa + Sea Level Pressure

GFS analysi map - Geopotential + Temp. at 500 hPa + Sea Level Pressure in Central Italy
									on December 17, 2014 H00

GFS 06Z - Central Italy
Geopotential + Temp. at 500 hPa + Sea Level Pressure

GFS analysi map - Geopotential + Temp. at 500 hPa + Sea Level Pressure in Central Italy
									on December 17, 2014 H06

GFS 12Z - Central Italy
Geopotential + Temp. at 500 hPa + Sea Level Pressure

GFS analysi map - Geopotential + Temp. at 500 hPa + Sea Level Pressure in Central Italy
									on December 17, 2014 H12

GFS 18Z - Central Italy
Geopotential + Temp. at 500 hPa + Sea Level Pressure

GFS analysi map - Geopotential + Temp. at 500 hPa + Sea Level Pressure in Central Italy
									on December 17, 2014 H18

GFS 00Z - Central Italy
Geopotential and Temperature at 850 hPa

GFS analysi map - Geopotential and Temperature at 850 hPa in Central Italy
									on December 17, 2014 H00

GFS 06Z - Central Italy
Geopotential and Temperature at 850 hPa

GFS analysi map - Geopotential and Temperature at 850 hPa in Central Italy
									on December 17, 2014 H06

GFS 12Z - Central Italy
Geopotential and Temperature at 850 hPa

GFS analysi map - Geopotential and Temperature at 850 hPa in Central Italy
									on December 17, 2014 H12

GFS 18Z - Central Italy
Geopotential and Temperature at 850 hPa

GFS analysi map - Geopotential and Temperature at 850 hPa in Central Italy
									on December 17, 2014 H18

GFS 00Z - Central Italy
Geopotential and Temperature at 925 hPa

GFS analysi map - Geopotential and Temperature at 925 hPa in Central Italy
									on December 17, 2014 H00

GFS 06Z - Central Italy
Geopotential and Temperature at 925 hPa

GFS analysi map - Geopotential and Temperature at 925 hPa in Central Italy
									on December 17, 2014 H06

GFS 12Z - Central Italy
Geopotential and Temperature at 925 hPa

GFS analysi map - Geopotential and Temperature at 925 hPa in Central Italy
									on December 17, 2014 H12

GFS 18Z - Central Italy
Geopotential and Temperature at 925 hPa

GFS analysi map - Geopotential and Temperature at 925 hPa in Central Italy
									on December 17, 2014 H18

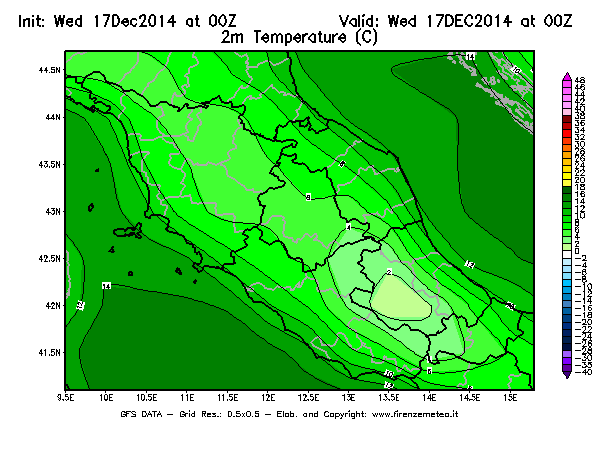
GFS 00Z - Central Italy
Temperature at 2 m above ground

GFS analysi map - Temperature at 2 m above ground in Central Italy
									on December 17, 2014 H00

GFS 06Z - Central Italy
Temperature at 2 m above ground

GFS analysi map - Temperature at 2 m above ground in Central Italy
									on December 17, 2014 H06

GFS 12Z - Central Italy
Temperature at 2 m above ground

GFS analysi map - Temperature at 2 m above ground in Central Italy
									on December 17, 2014 H12

GFS 18Z - Central Italy
Temperature at 2 m above ground

GFS analysi map - Temperature at 2 m above ground in Central Italy
									on December 17, 2014 H18

GFS 00Z - Central Italy
Temperature Anomalies at 2 m

GFS analysi map - Temperature Anomalies at 2 m in Central Italy
									on December 17, 2014 H00

GFS 06Z - Central Italy
Temperature Anomalies at 2 m

GFS analysi map - Temperature Anomalies at 2 m in Central Italy
									on December 17, 2014 H06

GFS 12Z - Central Italy
Temperature Anomalies at 2 m

GFS analysi map - Temperature Anomalies at 2 m in Central Italy
									on December 17, 2014 H12

GFS 18Z - Central Italy
Temperature Anomalies at 2 m

GFS analysi map - Temperature Anomalies at 2 m in Central Italy
									on December 17, 2014 H18

GFS 00Z - Central Italy
Temperature Anomalies at 850 hPa

GFS analysi map - Temperature Anomalies at 850 hPa in Central Italy
									on December 17, 2014 H00

GFS 06Z - Central Italy
Temperature Anomalies at 850 hPa

GFS analysi map - Temperature Anomalies at 850 hPa in Central Italy
									on December 17, 2014 H06

GFS 12Z - Central Italy
Temperature Anomalies at 850 hPa

GFS analysi map - Temperature Anomalies at 850 hPa in Central Italy
									on December 17, 2014 H12

GFS 18Z - Central Italy
Temperature Anomalies at 850 hPa

GFS analysi map - Temperature Anomalies at 850 hPa in Central Italy
									on December 17, 2014 H18

GFS 00Z - Central Italy
Temperature Anomalies at 500 hPa

GFS analysi map - Temperature Anomalies at 500 hPa in Central Italy
									on December 17, 2014 H00

GFS 06Z - Central Italy
Temperature Anomalies at 500 hPa

GFS analysi map - Temperature Anomalies at 500 hPa in Central Italy
									on December 17, 2014 H06

GFS 12Z - Central Italy
Temperature Anomalies at 500 hPa

GFS analysi map - Temperature Anomalies at 500 hPa in Central Italy
									on December 17, 2014 H12

GFS 18Z - Central Italy
Temperature Anomalies at 500 hPa

GFS analysi map - Temperature Anomalies at 500 hPa in Central Italy
									on December 17, 2014 H18

GFS 00Z - Central Italy
Wind Speed at 10 m above ground

GFS analysi map - Wind Speed at 10 m above ground in Central Italy
									on December 17, 2014 H00

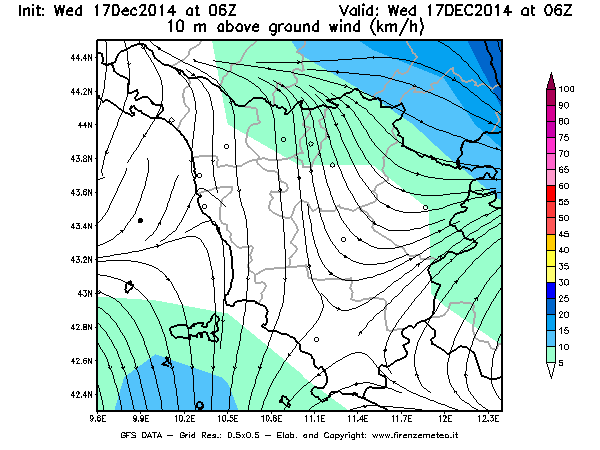
GFS 06Z - Central Italy
Wind Speed at 10 m above ground

GFS analysi map - Wind Speed at 10 m above ground in Central Italy
									on December 17, 2014 H06

GFS 12Z - Central Italy
Wind Speed at 10 m above ground

GFS analysi map - Wind Speed at 10 m above ground in Central Italy
									on December 17, 2014 H12

GFS 18Z - Central Italy
Wind Speed at 10 m above ground

GFS analysi map - Wind Speed at 10 m above ground in Central Italy
									on December 17, 2014 H18

GFS 00Z - Central Italy
CAPE and Lifted Index

GFS analysi map - CAPE and Lifted Index in Central Italy
									on December 17, 2014 H00

GFS 06Z - Central Italy
CAPE and Lifted Index

GFS analysi map - CAPE and Lifted Index in Central Italy
									on December 17, 2014 H06

GFS 12Z - Central Italy
CAPE and Lifted Index

GFS analysi map - CAPE and Lifted Index in Central Italy
									on December 17, 2014 H12

GFS 18Z - Central Italy
CAPE and Lifted Index

GFS analysi map - CAPE and Lifted Index in Central Italy
									on December 17, 2014 H18

GFS 00Z - Central Italy
CIN

GFS analysi map - CIN in Central Italy
									on December 17, 2014 H00

GFS 06Z - Central Italy
CIN

GFS analysi map - CIN in Central Italy
									on December 17, 2014 H06

GFS 12Z - Central Italy
CIN

GFS analysi map - CIN in Central Italy
									on December 17, 2014 H12

GFS 18Z - Central Italy
CIN

GFS analysi map - CIN in Central Italy
									on December 17, 2014 H18

GFS maps - Southern Italy - December 17, 2014

Click on the maps to enlarge.

GFS 00Z - Southern Italy
Geopotential + Temp. at 500 hPa + Sea Level Pressure

GFS analysi map - Geopotential + Temp. at 500 hPa + Sea Level Pressure in Southern Italy
									on December 17, 2014 H00

GFS 06Z - Southern Italy
Geopotential + Temp. at 500 hPa + Sea Level Pressure

GFS analysi map - Geopotential + Temp. at 500 hPa + Sea Level Pressure in Southern Italy
									on December 17, 2014 H06

GFS 12Z - Southern Italy
Geopotential + Temp. at 500 hPa + Sea Level Pressure

GFS analysi map - Geopotential + Temp. at 500 hPa + Sea Level Pressure in Southern Italy
									on December 17, 2014 H12

GFS 18Z - Southern Italy
Geopotential + Temp. at 500 hPa + Sea Level Pressure

GFS analysi map - Geopotential + Temp. at 500 hPa + Sea Level Pressure in Southern Italy
									on December 17, 2014 H18

GFS 00Z - Southern Italy
Geopotential and Temperature at 850 hPa

GFS analysi map - Geopotential and Temperature at 850 hPa in Southern Italy
									on December 17, 2014 H00

GFS 06Z - Southern Italy
Geopotential and Temperature at 850 hPa

GFS analysi map - Geopotential and Temperature at 850 hPa in Southern Italy
									on December 17, 2014 H06

GFS 12Z - Southern Italy
Geopotential and Temperature at 850 hPa

GFS analysi map - Geopotential and Temperature at 850 hPa in Southern Italy
									on December 17, 2014 H12

GFS 18Z - Southern Italy
Geopotential and Temperature at 850 hPa

GFS analysi map - Geopotential and Temperature at 850 hPa in Southern Italy
									on December 17, 2014 H18

GFS 00Z - Southern Italy
Geopotential and Temperature at 925 hPa

GFS analysi map - Geopotential and Temperature at 925 hPa in Southern Italy
									on December 17, 2014 H00

GFS 06Z - Southern Italy
Geopotential and Temperature at 925 hPa

GFS analysi map - Geopotential and Temperature at 925 hPa in Southern Italy
									on December 17, 2014 H06

GFS 12Z - Southern Italy
Geopotential and Temperature at 925 hPa

GFS analysi map - Geopotential and Temperature at 925 hPa in Southern Italy
									on December 17, 2014 H12

GFS 18Z - Southern Italy
Geopotential and Temperature at 925 hPa

GFS analysi map - Geopotential and Temperature at 925 hPa in Southern Italy
									on December 17, 2014 H18

GFS 00Z - Southern Italy
Temperature at 2 m above ground

GFS analysi map - Temperature at 2 m above ground in Southern Italy
									on December 17, 2014 H00

GFS 06Z - Southern Italy
Temperature at 2 m above ground

GFS analysi map - Temperature at 2 m above ground in Southern Italy
									on December 17, 2014 H06

GFS 12Z - Southern Italy
Temperature at 2 m above ground

GFS analysi map - Temperature at 2 m above ground in Southern Italy
									on December 17, 2014 H12

GFS 18Z - Southern Italy
Temperature at 2 m above ground

GFS analysi map - Temperature at 2 m above ground in Southern Italy
									on December 17, 2014 H18

GFS 00Z - Southern Italy
Temperature Anomalies at 2 m

GFS analysi map - Temperature Anomalies at 2 m in Southern Italy
									on December 17, 2014 H00

GFS 06Z - Southern Italy
Temperature Anomalies at 2 m

GFS analysi map - Temperature Anomalies at 2 m in Southern Italy
									on December 17, 2014 H06

GFS 12Z - Southern Italy
Temperature Anomalies at 2 m

GFS analysi map - Temperature Anomalies at 2 m in Southern Italy
									on December 17, 2014 H12

GFS 18Z - Southern Italy
Temperature Anomalies at 2 m

GFS analysi map - Temperature Anomalies at 2 m in Southern Italy
									on December 17, 2014 H18

GFS 00Z - Southern Italy
Temperature Anomalies at 850 hPa

GFS analysi map - Temperature Anomalies at 850 hPa in Southern Italy
									on December 17, 2014 H00

GFS 06Z - Southern Italy
Temperature Anomalies at 850 hPa

GFS analysi map - Temperature Anomalies at 850 hPa in Southern Italy
									on December 17, 2014 H06

GFS 12Z - Southern Italy
Temperature Anomalies at 850 hPa

GFS analysi map - Temperature Anomalies at 850 hPa in Southern Italy
									on December 17, 2014 H12

GFS 18Z - Southern Italy
Temperature Anomalies at 850 hPa

GFS analysi map - Temperature Anomalies at 850 hPa in Southern Italy
									on December 17, 2014 H18

GFS 00Z - Southern Italy
Temperature Anomalies at 500 hPa

GFS analysi map - Temperature Anomalies at 500 hPa in Southern Italy
									on December 17, 2014 H00

GFS 06Z - Southern Italy
Temperature Anomalies at 500 hPa

GFS analysi map - Temperature Anomalies at 500 hPa in Southern Italy
									on December 17, 2014 H06

GFS 12Z - Southern Italy
Temperature Anomalies at 500 hPa

GFS analysi map - Temperature Anomalies at 500 hPa in Southern Italy
									on December 17, 2014 H12

GFS 18Z - Southern Italy
Temperature Anomalies at 500 hPa

GFS analysi map - Temperature Anomalies at 500 hPa in Southern Italy
									on December 17, 2014 H18

GFS 00Z - Southern Italy
Wind Speed at 10 m above ground

GFS analysi map - Wind Speed at 10 m above ground in Southern Italy
									on December 17, 2014 H00

GFS 06Z - Southern Italy
Wind Speed at 10 m above ground

GFS analysi map - Wind Speed at 10 m above ground in Southern Italy
									on December 17, 2014 H06

GFS 12Z - Southern Italy
Wind Speed at 10 m above ground

GFS analysi map - Wind Speed at 10 m above ground in Southern Italy
									on December 17, 2014 H12

GFS 18Z - Southern Italy
Wind Speed at 10 m above ground

GFS analysi map - Wind Speed at 10 m above ground in Southern Italy
									on December 17, 2014 H18

GFS 00Z - Southern Italy
CAPE and Lifted Index

GFS analysi map - CAPE and Lifted Index in Southern Italy
									on December 17, 2014 H00

GFS 06Z - Southern Italy
CAPE and Lifted Index

GFS analysi map - CAPE and Lifted Index in Southern Italy
									on December 17, 2014 H06

GFS 12Z - Southern Italy
CAPE and Lifted Index

GFS analysi map - CAPE and Lifted Index in Southern Italy
									on December 17, 2014 H12

GFS 18Z - Southern Italy
CAPE and Lifted Index

GFS analysi map - CAPE and Lifted Index in Southern Italy
									on December 17, 2014 H18

GFS 00Z - Southern Italy
CIN

GFS analysi map - CIN in Southern Italy
									on December 17, 2014 H00

GFS 06Z - Southern Italy
CIN

GFS analysi map - CIN in Southern Italy
									on December 17, 2014 H06

GFS 12Z - Southern Italy
CIN

GFS analysi map - CIN in Southern Italy
									on December 17, 2014 H12

GFS 18Z - Southern Italy
CIN

GFS analysi map - CIN in Southern Italy
									on December 17, 2014 H18

GFS maps - Tuscany - December 17, 2014

Click on the maps to enlarge.

GFS 00Z - Tuscany
Temperature at 2 m above ground

GFS analysi map - Temperature at 2 m above ground in Tuscany
									on December 17, 2014 H00

GFS 06Z - Tuscany
Temperature at 2 m above ground

GFS analysi map - Temperature at 2 m above ground in Tuscany
									on December 17, 2014 H06

GFS 12Z - Tuscany
Temperature at 2 m above ground

GFS analysi map - Temperature at 2 m above ground in Tuscany
									on December 17, 2014 H12

GFS 18Z - Tuscany
Temperature at 2 m above ground

GFS analysi map - Temperature at 2 m above ground in Tuscany
									on December 17, 2014 H18

GFS 00Z - Tuscany
Temperature Anomalies at 2 m

GFS analysi map - Temperature Anomalies at 2 m in Tuscany
									on December 17, 2014 H00

GFS 06Z - Tuscany
Temperature Anomalies at 2 m

GFS analysi map - Temperature Anomalies at 2 m in Tuscany
									on December 17, 2014 H06

GFS 12Z - Tuscany
Temperature Anomalies at 2 m

GFS analysi map - Temperature Anomalies at 2 m in Tuscany
									on December 17, 2014 H12

GFS 18Z - Tuscany
Temperature Anomalies at 2 m

GFS analysi map - Temperature Anomalies at 2 m in Tuscany
									on December 17, 2014 H18

GFS 00Z - Tuscany
Temperature Anomalies at 850 hPa

GFS analysi map - Temperature Anomalies at 850 hPa in Tuscany
									on December 17, 2014 H00

GFS 06Z - Tuscany
Temperature Anomalies at 850 hPa

GFS analysi map - Temperature Anomalies at 850 hPa in Tuscany
									on December 17, 2014 H06

GFS 12Z - Tuscany
Temperature Anomalies at 850 hPa

GFS analysi map - Temperature Anomalies at 850 hPa in Tuscany
									on December 17, 2014 H12

GFS 18Z - Tuscany
Temperature Anomalies at 850 hPa

GFS analysi map - Temperature Anomalies at 850 hPa in Tuscany
									on December 17, 2014 H18

GFS 00Z - Tuscany
Temperature Anomalies at 500 hPa

GFS analysi map - Temperature Anomalies at 500 hPa in Tuscany
									on December 17, 2014 H00

GFS 06Z - Tuscany
Temperature Anomalies at 500 hPa

GFS analysi map - Temperature Anomalies at 500 hPa in Tuscany
									on December 17, 2014 H06

GFS 12Z - Tuscany
Temperature Anomalies at 500 hPa

GFS analysi map - Temperature Anomalies at 500 hPa in Tuscany
									on December 17, 2014 H12

GFS 18Z - Tuscany
Temperature Anomalies at 500 hPa

GFS analysi map - Temperature Anomalies at 500 hPa in Tuscany
									on December 17, 2014 H18

GFS 00Z - Tuscany
Wind Speed at 10 m above ground

GFS analysi map - Wind Speed at 10 m above ground in Tuscany
									on December 17, 2014 H00

GFS 06Z - Tuscany
Wind Speed at 10 m above ground

GFS analysi map - Wind Speed at 10 m above ground in Tuscany
									on December 17, 2014 H06

GFS 12Z - Tuscany
Wind Speed at 10 m above ground

GFS analysi map - Wind Speed at 10 m above ground in Tuscany
									on December 17, 2014 H12

GFS 18Z - Tuscany
Wind Speed at 10 m above ground

GFS analysi map - Wind Speed at 10 m above ground in Tuscany
									on December 17, 2014 H18

GFS 00Z - Tuscany
CAPE and Lifted Index

GFS analysi map - CAPE and Lifted Index in Tuscany
									on December 17, 2014 H00

GFS 06Z - Tuscany
CAPE and Lifted Index

GFS analysi map - CAPE and Lifted Index in Tuscany
									on December 17, 2014 H06

GFS 12Z - Tuscany
CAPE and Lifted Index

GFS analysi map - CAPE and Lifted Index in Tuscany
									on December 17, 2014 H12

GFS 18Z - Tuscany
CAPE and Lifted Index

GFS analysi map - CAPE and Lifted Index in Tuscany
									on December 17, 2014 H18

GFS 00Z - Tuscany
CIN

GFS analysi map - CIN in Tuscany
									on December 17, 2014 H00

GFS 06Z - Tuscany
CIN

GFS analysi map - CIN in Tuscany
									on December 17, 2014 H06

GFS 12Z - Tuscany
CIN

GFS analysi map - CIN in Tuscany
									on December 17, 2014 H12

GFS 18Z - Tuscany
CIN

GFS analysi map - CIN in Tuscany
									on December 17, 2014 H18

GFS maps - North America - December 17, 2014

Click on the maps to enlarge.

GFS 00Z - North America
Geopotential + Temp. at 500 hPa + Sea Level Pressure

GFS analysi map - Geopotential + Temp. at 500 hPa + Sea Level Pressure in North America
									on December 17, 2014 H00

GFS 06Z - North America
Geopotential + Temp. at 500 hPa + Sea Level Pressure

GFS analysi map - Geopotential + Temp. at 500 hPa + Sea Level Pressure in North America
									on December 17, 2014 H06

GFS 12Z - North America
Geopotential + Temp. at 500 hPa + Sea Level Pressure

GFS analysi map - Geopotential + Temp. at 500 hPa + Sea Level Pressure in North America
									on December 17, 2014 H12

GFS 18Z - North America
Geopotential + Temp. at 500 hPa + Sea Level Pressure

GFS analysi map - Geopotential + Temp. at 500 hPa + Sea Level Pressure in North America
									on December 17, 2014 H18

GFS 00Z - North America
Geopotential and Temperature at 850 hPa

GFS analysi map - Geopotential and Temperature at 850 hPa in North America
									on December 17, 2014 H00

GFS 06Z - North America
Geopotential and Temperature at 850 hPa

GFS analysi map - Geopotential and Temperature at 850 hPa in North America
									on December 17, 2014 H06

GFS 12Z - North America
Geopotential and Temperature at 850 hPa

GFS analysi map - Geopotential and Temperature at 850 hPa in North America
									on December 17, 2014 H12

GFS 18Z - North America
Geopotential and Temperature at 850 hPa

GFS analysi map - Geopotential and Temperature at 850 hPa in North America
									on December 17, 2014 H18

GFS 00Z - North America
Temperature at 2 m above ground

GFS analysi map - Temperature at 2 m above ground in North America
									on December 17, 2014 H00

GFS 06Z - North America
Temperature at 2 m above ground

GFS analysi map - Temperature at 2 m above ground in North America
									on December 17, 2014 H06

GFS 12Z - North America
Temperature at 2 m above ground

GFS analysi map - Temperature at 2 m above ground in North America
									on December 17, 2014 H12

GFS 18Z - North America
Temperature at 2 m above ground

GFS analysi map - Temperature at 2 m above ground in North America
									on December 17, 2014 H18

GFS 00Z - North America
Wind Speed at 10 m above ground

GFS analysi map - Wind Speed at 10 m above ground in North America
									on December 17, 2014 H00

GFS 06Z - North America
Wind Speed at 10 m above ground

GFS analysi map - Wind Speed at 10 m above ground in North America
									on December 17, 2014 H06

GFS 12Z - North America
Wind Speed at 10 m above ground

GFS analysi map - Wind Speed at 10 m above ground in North America
									on December 17, 2014 H12

GFS 18Z - North America
Wind Speed at 10 m above ground

GFS analysi map - Wind Speed at 10 m above ground in North America
									on December 17, 2014 H18

GFS maps - Central America - December 17, 2014

Click on the maps to enlarge.

GFS 00Z - Central America
Geopotential + Temp. at 500 hPa + Sea Level Pressure

GFS analysi map - Geopotential + Temp. at 500 hPa + Sea Level Pressure in Central America
									on December 17, 2014 H00

GFS 06Z - Central America
Geopotential + Temp. at 500 hPa + Sea Level Pressure

GFS analysi map - Geopotential + Temp. at 500 hPa + Sea Level Pressure in Central America
									on December 17, 2014 H06

GFS 12Z - Central America
Geopotential + Temp. at 500 hPa + Sea Level Pressure

GFS analysi map - Geopotential + Temp. at 500 hPa + Sea Level Pressure in Central America
									on December 17, 2014 H12

GFS 18Z - Central America
Geopotential + Temp. at 500 hPa + Sea Level Pressure

GFS analysi map - Geopotential + Temp. at 500 hPa + Sea Level Pressure in Central America
									on December 17, 2014 H18

GFS 00Z - Central America
Geopotential and Temperature at 850 hPa

GFS analysi map - Geopotential and Temperature at 850 hPa in Central America
									on December 17, 2014 H00

GFS 06Z - Central America
Geopotential and Temperature at 850 hPa

GFS analysi map - Geopotential and Temperature at 850 hPa in Central America
									on December 17, 2014 H06

GFS 12Z - Central America
Geopotential and Temperature at 850 hPa

GFS analysi map - Geopotential and Temperature at 850 hPa in Central America
									on December 17, 2014 H12

GFS 18Z - Central America
Geopotential and Temperature at 850 hPa

GFS analysi map - Geopotential and Temperature at 850 hPa in Central America
									on December 17, 2014 H18

GFS 00Z - Central America
Temperature at 2 m above ground

GFS analysi map - Temperature at 2 m above ground in Central America
									on December 17, 2014 H00

GFS 06Z - Central America
Temperature at 2 m above ground

GFS analysi map - Temperature at 2 m above ground in Central America
									on December 17, 2014 H06

GFS 12Z - Central America
Temperature at 2 m above ground

GFS analysi map - Temperature at 2 m above ground in Central America
									on December 17, 2014 H12

GFS 18Z - Central America
Temperature at 2 m above ground

GFS analysi map - Temperature at 2 m above ground in Central America
									on December 17, 2014 H18

GFS 00Z - Central America
Wind Speed at 10 m above ground

GFS analysi map - Wind Speed at 10 m above ground in Central America
									on December 17, 2014 H00

GFS 06Z - Central America
Wind Speed at 10 m above ground

GFS analysi map - Wind Speed at 10 m above ground in Central America
									on December 17, 2014 H06

GFS 12Z - Central America
Wind Speed at 10 m above ground

GFS analysi map - Wind Speed at 10 m above ground in Central America
									on December 17, 2014 H12

GFS 18Z - Central America
Wind Speed at 10 m above ground

GFS analysi map - Wind Speed at 10 m above ground in Central America
									on December 17, 2014 H18

GFS maps - South America - December 17, 2014

Click on the maps to enlarge.

GFS 00Z - South America
Geopotential + Temp. at 500 hPa + Sea Level Pressure

GFS analysi map - Geopotential + Temp. at 500 hPa + Sea Level Pressure in South America
									on December 17, 2014 H00

GFS 06Z - South America
Geopotential + Temp. at 500 hPa + Sea Level Pressure

GFS analysi map - Geopotential + Temp. at 500 hPa + Sea Level Pressure in South America
									on December 17, 2014 H06

GFS 12Z - South America
Geopotential + Temp. at 500 hPa + Sea Level Pressure

GFS analysi map - Geopotential + Temp. at 500 hPa + Sea Level Pressure in South America
									on December 17, 2014 H12

GFS 18Z - South America
Geopotential + Temp. at 500 hPa + Sea Level Pressure

GFS analysi map - Geopotential + Temp. at 500 hPa + Sea Level Pressure in South America
									on December 17, 2014 H18

GFS 00Z - South America
Geopotential and Temperature at 850 hPa

GFS analysi map - Geopotential and Temperature at 850 hPa in South America
									on December 17, 2014 H00

GFS 06Z - South America
Geopotential and Temperature at 850 hPa

GFS analysi map - Geopotential and Temperature at 850 hPa in South America
									on December 17, 2014 H06

GFS 12Z - South America
Geopotential and Temperature at 850 hPa

GFS analysi map - Geopotential and Temperature at 850 hPa in South America
									on December 17, 2014 H12

GFS 18Z - South America
Geopotential and Temperature at 850 hPa

GFS analysi map - Geopotential and Temperature at 850 hPa in South America
									on December 17, 2014 H18

GFS 00Z - South America
Temperature at 2 m above ground

GFS analysi map - Temperature at 2 m above ground in South America
									on December 17, 2014 H00

GFS 06Z - South America
Temperature at 2 m above ground

GFS analysi map - Temperature at 2 m above ground in South America
									on December 17, 2014 H06

GFS 12Z - South America
Temperature at 2 m above ground

GFS analysi map - Temperature at 2 m above ground in South America
									on December 17, 2014 H12

GFS 18Z - South America
Temperature at 2 m above ground

GFS analysi map - Temperature at 2 m above ground in South America
									on December 17, 2014 H18

GFS 00Z - South America
Wind Speed at 10 m above ground

GFS analysi map - Wind Speed at 10 m above ground in South America
									on December 17, 2014 H00

GFS 06Z - South America
Wind Speed at 10 m above ground

GFS analysi map - Wind Speed at 10 m above ground in South America
									on December 17, 2014 H06

GFS 12Z - South America
Wind Speed at 10 m above ground

GFS analysi map - Wind Speed at 10 m above ground in South America
									on December 17, 2014 H12

GFS 18Z - South America
Wind Speed at 10 m above ground

GFS analysi map - Wind Speed at 10 m above ground in South America
									on December 17, 2014 H18

GFS maps - Africa - December 17, 2014

Click on the maps to enlarge.

GFS 00Z - Africa
Geopotential + Temp. at 500 hPa + Sea Level Pressure

GFS analysi map - Geopotential + Temp. at 500 hPa + Sea Level Pressure in Africa
									on December 17, 2014 H00

GFS 06Z - Africa
Geopotential + Temp. at 500 hPa + Sea Level Pressure

GFS analysi map - Geopotential + Temp. at 500 hPa + Sea Level Pressure in Africa
									on December 17, 2014 H06

GFS 12Z - Africa
Geopotential + Temp. at 500 hPa + Sea Level Pressure

GFS analysi map - Geopotential + Temp. at 500 hPa + Sea Level Pressure in Africa
									on December 17, 2014 H12

GFS 18Z - Africa
Geopotential + Temp. at 500 hPa + Sea Level Pressure

GFS analysi map - Geopotential + Temp. at 500 hPa + Sea Level Pressure in Africa
									on December 17, 2014 H18

GFS 00Z - Africa
Geopotential and Temperature at 850 hPa

GFS analysi map - Geopotential and Temperature at 850 hPa in Africa
									on December 17, 2014 H00

GFS 06Z - Africa
Geopotential and Temperature at 850 hPa

GFS analysi map - Geopotential and Temperature at 850 hPa in Africa
									on December 17, 2014 H06

GFS 12Z - Africa
Geopotential and Temperature at 850 hPa

GFS analysi map - Geopotential and Temperature at 850 hPa in Africa
									on December 17, 2014 H12

GFS 18Z - Africa
Geopotential and Temperature at 850 hPa

GFS analysi map - Geopotential and Temperature at 850 hPa in Africa
									on December 17, 2014 H18

GFS 00Z - Africa
Temperature at 2 m above ground

GFS analysi map - Temperature at 2 m above ground in Africa
									on December 17, 2014 H00

GFS 06Z - Africa
Temperature at 2 m above ground

GFS analysi map - Temperature at 2 m above ground in Africa
									on December 17, 2014 H06

GFS 12Z - Africa
Temperature at 2 m above ground

GFS analysi map - Temperature at 2 m above ground in Africa
									on December 17, 2014 H12

GFS 18Z - Africa
Temperature at 2 m above ground

GFS analysi map - Temperature at 2 m above ground in Africa
									on December 17, 2014 H18

GFS 00Z - Africa
Wind Speed at 10 m above ground

GFS analysi map - Wind Speed at 10 m above ground in Africa
									on December 17, 2014 H00

GFS 06Z - Africa
Wind Speed at 10 m above ground

GFS analysi map - Wind Speed at 10 m above ground in Africa
									on December 17, 2014 H06

GFS 12Z - Africa
Wind Speed at 10 m above ground

GFS analysi map - Wind Speed at 10 m above ground in Africa
									on December 17, 2014 H12

GFS 18Z - Africa
Wind Speed at 10 m above ground

GFS analysi map - Wind Speed at 10 m above ground in Africa
									on December 17, 2014 H18

GFS maps - East Asia - December 17, 2014

Click on the maps to enlarge.

GFS 00Z - East Asia
Geopotential + Temp. at 500 hPa + Sea Level Pressure

GFS analysi map - Geopotential + Temp. at 500 hPa + Sea Level Pressure in East Asia
									on December 17, 2014 H00

GFS 06Z - East Asia
Geopotential + Temp. at 500 hPa + Sea Level Pressure

GFS analysi map - Geopotential + Temp. at 500 hPa + Sea Level Pressure in East Asia
									on December 17, 2014 H06

GFS 12Z - East Asia
Geopotential + Temp. at 500 hPa + Sea Level Pressure

GFS analysi map - Geopotential + Temp. at 500 hPa + Sea Level Pressure in East Asia
									on December 17, 2014 H12

GFS 18Z - East Asia
Geopotential + Temp. at 500 hPa + Sea Level Pressure

GFS analysi map - Geopotential + Temp. at 500 hPa + Sea Level Pressure in East Asia
									on December 17, 2014 H18

GFS 00Z - East Asia
Geopotential and Temperature at 850 hPa

GFS analysi map - Geopotential and Temperature at 850 hPa in East Asia
									on December 17, 2014 H00

GFS 06Z - East Asia
Geopotential and Temperature at 850 hPa

GFS analysi map - Geopotential and Temperature at 850 hPa in East Asia
									on December 17, 2014 H06

GFS 12Z - East Asia
Geopotential and Temperature at 850 hPa

GFS analysi map - Geopotential and Temperature at 850 hPa in East Asia
									on December 17, 2014 H12

GFS 18Z - East Asia
Geopotential and Temperature at 850 hPa

GFS analysi map - Geopotential and Temperature at 850 hPa in East Asia
									on December 17, 2014 H18

GFS 00Z - East Asia
Temperature at 2 m above ground

GFS analysi map - Temperature at 2 m above ground in East Asia
									on December 17, 2014 H00

GFS 06Z - East Asia
Temperature at 2 m above ground

GFS analysi map - Temperature at 2 m above ground in East Asia
									on December 17, 2014 H06

GFS 12Z - East Asia
Temperature at 2 m above ground

GFS analysi map - Temperature at 2 m above ground in East Asia
									on December 17, 2014 H12

GFS 18Z - East Asia
Temperature at 2 m above ground

GFS analysi map - Temperature at 2 m above ground in East Asia
									on December 17, 2014 H18

GFS 00Z - East Asia
Wind Speed at 10 m above ground

GFS analysi map - Wind Speed at 10 m above ground in East Asia
									on December 17, 2014 H00

GFS 06Z - East Asia
Wind Speed at 10 m above ground

GFS analysi map - Wind Speed at 10 m above ground in East Asia
									on December 17, 2014 H06

GFS 12Z - East Asia
Wind Speed at 10 m above ground

GFS analysi map - Wind Speed at 10 m above ground in East Asia
									on December 17, 2014 H12

GFS 18Z - East Asia
Wind Speed at 10 m above ground

GFS analysi map - Wind Speed at 10 m above ground in East Asia
									on December 17, 2014 H18

GFS maps - South West Asia - December 17, 2014

Click on the maps to enlarge.

GFS 00Z - South West Asia
Geopotential + Temp. at 500 hPa + Sea Level Pressure

GFS analysi map - Geopotential + Temp. at 500 hPa + Sea Level Pressure in South West Asia 
									on December 17, 2014 H00

GFS 06Z - South West Asia
Geopotential + Temp. at 500 hPa + Sea Level Pressure

GFS analysi map - Geopotential + Temp. at 500 hPa + Sea Level Pressure in South West Asia 
									on December 17, 2014 H06

GFS 12Z - South West Asia
Geopotential + Temp. at 500 hPa + Sea Level Pressure

GFS analysi map - Geopotential + Temp. at 500 hPa + Sea Level Pressure in South West Asia 
									on December 17, 2014 H12

GFS 18Z - South West Asia
Geopotential + Temp. at 500 hPa + Sea Level Pressure

GFS analysi map - Geopotential + Temp. at 500 hPa + Sea Level Pressure in South West Asia 
									on December 17, 2014 H18

GFS 00Z - South West Asia
Geopotential and Temperature at 850 hPa

GFS analysi map - Geopotential and Temperature at 850 hPa in South West Asia 
									on December 17, 2014 H00

GFS 06Z - South West Asia
Geopotential and Temperature at 850 hPa

GFS analysi map - Geopotential and Temperature at 850 hPa in South West Asia 
									on December 17, 2014 H06

GFS 12Z - South West Asia
Geopotential and Temperature at 850 hPa

GFS analysi map - Geopotential and Temperature at 850 hPa in South West Asia 
									on December 17, 2014 H12

GFS 18Z - South West Asia
Geopotential and Temperature at 850 hPa

GFS analysi map - Geopotential and Temperature at 850 hPa in South West Asia 
									on December 17, 2014 H18

GFS 00Z - South West Asia
Temperature at 2 m above ground

GFS analysi map - Temperature at 2 m above ground in South West Asia 
									on December 17, 2014 H00

GFS 06Z - South West Asia
Temperature at 2 m above ground

GFS analysi map - Temperature at 2 m above ground in South West Asia 
									on December 17, 2014 H06

GFS 12Z - South West Asia
Temperature at 2 m above ground

GFS analysi map - Temperature at 2 m above ground in South West Asia 
									on December 17, 2014 H12

GFS 18Z - South West Asia
Temperature at 2 m above ground

GFS analysi map - Temperature at 2 m above ground in South West Asia 
									on December 17, 2014 H18

GFS 00Z - South West Asia
Wind Speed at 10 m above ground

GFS analysi map - Wind Speed at 10 m above ground in South West Asia 
									on December 17, 2014 H00

GFS 06Z - South West Asia
Wind Speed at 10 m above ground

GFS analysi map - Wind Speed at 10 m above ground in South West Asia 
									on December 17, 2014 H06

GFS 12Z - South West Asia
Wind Speed at 10 m above ground

GFS analysi map - Wind Speed at 10 m above ground in South West Asia 
									on December 17, 2014 H12

GFS 18Z - South West Asia
Wind Speed at 10 m above ground

GFS analysi map - Wind Speed at 10 m above ground in South West Asia 
									on December 17, 2014 H18

GFS maps - Oceania - December 17, 2014

Click on the maps to enlarge.

GFS 00Z - Oceania
Geopotential + Temp. at 500 hPa + Sea Level Pressure

GFS analysi map - Geopotential + Temp. at 500 hPa + Sea Level Pressure in Oceania
									on December 17, 2014 H00

GFS 06Z - Oceania
Geopotential + Temp. at 500 hPa + Sea Level Pressure

GFS analysi map - Geopotential + Temp. at 500 hPa + Sea Level Pressure in Oceania
									on December 17, 2014 H06

GFS 12Z - Oceania
Geopotential + Temp. at 500 hPa + Sea Level Pressure

GFS analysi map - Geopotential + Temp. at 500 hPa + Sea Level Pressure in Oceania
									on December 17, 2014 H12

GFS 18Z - Oceania
Geopotential + Temp. at 500 hPa + Sea Level Pressure

GFS analysi map - Geopotential + Temp. at 500 hPa + Sea Level Pressure in Oceania
									on December 17, 2014 H18

GFS 00Z - Oceania
Geopotential and Temperature at 850 hPa

GFS analysi map - Geopotential and Temperature at 850 hPa in Oceania
									on December 17, 2014 H00

GFS 06Z - Oceania
Geopotential and Temperature at 850 hPa

GFS analysi map - Geopotential and Temperature at 850 hPa in Oceania
									on December 17, 2014 H06

GFS 12Z - Oceania
Geopotential and Temperature at 850 hPa

GFS analysi map - Geopotential and Temperature at 850 hPa in Oceania
									on December 17, 2014 H12

GFS 18Z - Oceania
Geopotential and Temperature at 850 hPa

GFS analysi map - Geopotential and Temperature at 850 hPa in Oceania
									on December 17, 2014 H18

GFS 00Z - Oceania
Temperature at 2 m above ground

GFS analysi map - Temperature at 2 m above ground in Oceania
									on December 17, 2014 H00

GFS 06Z - Oceania
Temperature at 2 m above ground

GFS analysi map - Temperature at 2 m above ground in Oceania
									on December 17, 2014 H06

GFS 12Z - Oceania
Temperature at 2 m above ground

GFS analysi map - Temperature at 2 m above ground in Oceania
									on December 17, 2014 H12

GFS 18Z - Oceania
Temperature at 2 m above ground

GFS analysi map - Temperature at 2 m above ground in Oceania
									on December 17, 2014 H18

GFS 00Z - Oceania
Wind Speed at 10 m above ground

GFS analysi map - Wind Speed at 10 m above ground in Oceania
									on December 17, 2014 H00

GFS 06Z - Oceania
Wind Speed at 10 m above ground

GFS analysi map - Wind Speed at 10 m above ground in Oceania
									on December 17, 2014 H06

GFS 12Z - Oceania
Wind Speed at 10 m above ground

GFS analysi map - Wind Speed at 10 m above ground in Oceania
									on December 17, 2014 H12

GFS 18Z - Oceania
Wind Speed at 10 m above ground

GFS analysi map - Wind Speed at 10 m above ground in Oceania
									on December 17, 2014 H18

GFS maps - World - December 17, 2014

Click on the maps to enlarge.

GFS 00Z - World
Temperature Anomalies at 2 m

GFS analysi map - Temperature Anomalies at 2 m in World
									on December 17, 2014 H00

GFS 06Z - World
Temperature Anomalies at 2 m

GFS analysi map - Temperature Anomalies at 2 m in World
									on December 17, 2014 H06

GFS 12Z - World
Temperature Anomalies at 2 m

GFS analysi map - Temperature Anomalies at 2 m in World
									on December 17, 2014 H12

GFS 18Z - World
Temperature Anomalies at 2 m

GFS analysi map - Temperature Anomalies at 2 m in World
									on December 17, 2014 H18

GFS 00Z - World
Temperature Anomalies at 850 hPa

GFS analysi map - Temperature Anomalies at 850 hPa in World
									on December 17, 2014 H00

GFS 06Z - World
Temperature Anomalies at 850 hPa

GFS analysi map - Temperature Anomalies at 850 hPa in World
									on December 17, 2014 H06

GFS 12Z - World
Temperature Anomalies at 850 hPa

GFS analysi map - Temperature Anomalies at 850 hPa in World
									on December 17, 2014 H12

GFS 18Z - World
Temperature Anomalies at 850 hPa

GFS analysi map - Temperature Anomalies at 850 hPa in World
									on December 17, 2014 H18

GFS 00Z - World
Temperature Anomalies at 500 hPa

GFS analysi map - Temperature Anomalies at 500 hPa in World
									on December 17, 2014 H00

GFS 06Z - World
Temperature Anomalies at 500 hPa

GFS analysi map - Temperature Anomalies at 500 hPa in World
									on December 17, 2014 H06

GFS 12Z - World
Temperature Anomalies at 500 hPa

GFS analysi map - Temperature Anomalies at 500 hPa in World
									on December 17, 2014 H12

GFS 18Z - World
Temperature Anomalies at 500 hPa

GFS analysi map - Temperature Anomalies at 500 hPa in World
									on December 17, 2014 H18